


Small Towns, Big Returns - Part I
What Cartesian Graphing Can Tell Us About How Small Communities Could Be Halifax’s Real Future, and Why Halifax Needs to Right-Size Its Growth Strategy

This is the first in a multipart essay on the diminishing returns of growth in Canada’s nicest cities.
Let’s start with a simple truth: I love Coca-Cola.
More precisely, I love that first cold sip on a hot day. When it’s from a glass bottle or freshest of fountains, it's the perfect marriage of sugar, carbonation, and chill, especially when paired with a burger, fish and chips, or pizza. Or maybe a classic clubhouse… But by the third or fourth sip, something shifts. The magic dissipates. What started as refreshment becomes overindulgence, and suddenly, I’m drowning in sweetness.
This experience hints at my main idea running through this blog: more isn’t always better.
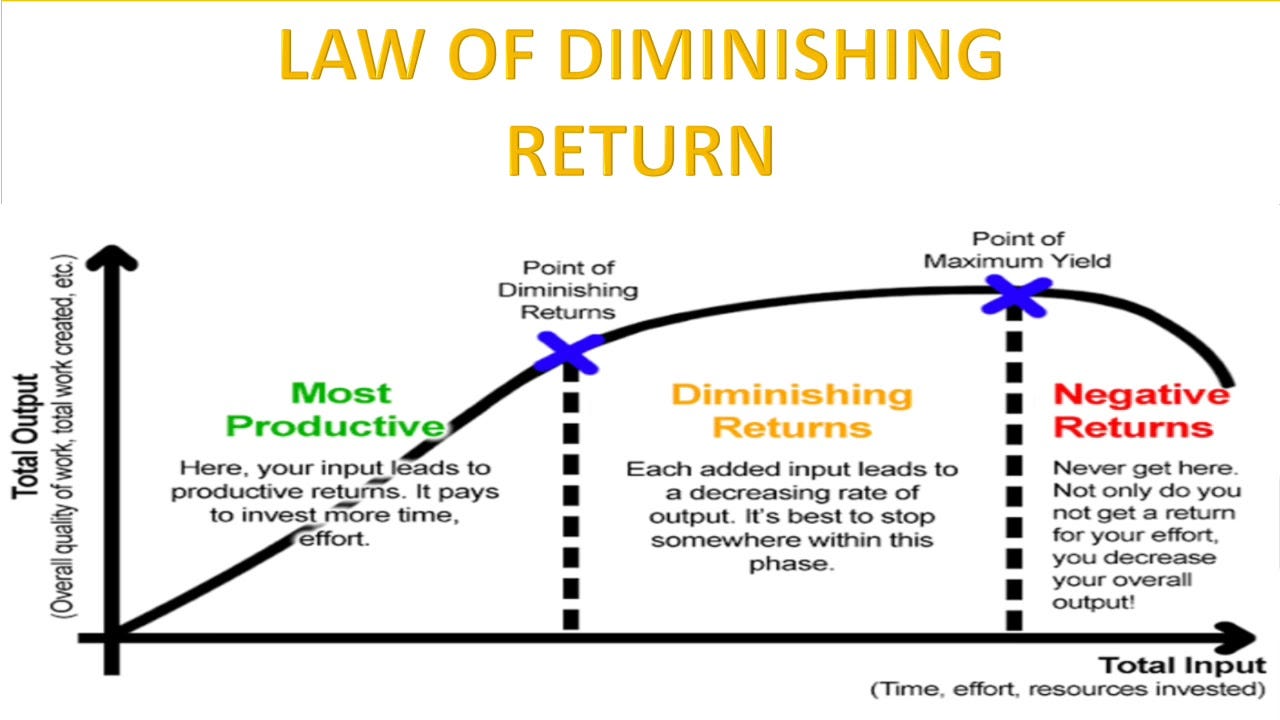
In fact, in most things, life rarely follows a straight, upward line of improvement. Instead, it curves. If you plot almost anything—be it wealth, learning, happiness, or even Coke consumption—on a graph, you’ll find that after a certain point, the benefits start to taper off. Economists call this the law of diminishing returns, but it’s more than just a theoretical concept from your Economics 101 class. It’s a reality that affects everything from our daily habits to the shape of our city.
Diminishing Returns: Your First Sip of Coke
The law of diminishing returns is a foundational idea in economics, tracing its roots back to the early 19th century. It’s the principle that, as you increase one factor of production—be it labor, land, or raw materials—while keeping others constant, the additional output generated eventually decreases. It’s that moment when adding more workers to a small café doesn’t improve service, but just makes the space more crowded.
But this idea isn’t confined to coffee shops and labor. It permeates every part of life. That first cold sip of Coke is perfection; the second, pretty good; by the third, you start to feel the excess. What’s happening here is that each additional sip gives you less of the pleasure the first one delivered. Economically speaking, the marginal utility—the benefit you get from each extra sip—decreases. By the fifth sip, you might even regret opening the bottle in the first place.
This curve, this diminishing return on everything we consume or experience, is a law of life, not just economics.
All Lines Are Curves: From Soda to Society
The reason this is so crucial is that many of us are stuck thinking in straight lines. And we’re sold that way too by hard and soft sellers, hucksters, and pitchmen of all sort. We assume that if a little is good, more must be better. This is the core idea behind exponential growth, the myth that our wealth, happiness, and even our societies can grow infinitely, provided we keep feeding the system. But this isn’t how the real world works. Nature itself follows a pattern of S-shaped curves, where initial growth is rapid, then it slows, and eventually plateaus.
Population growth. For decades, were warned about the dangers of overpopulation. It was the Climate Change media story of the Seventies that drove the environmental movment. But as economies develop and birth rates decline, the once-feared explosion is curving into decline in most of the world such that it was revealed the real problem was always population collapse.

Sidebar: Hey Environmental movment, you really don’t need a bogeyman, a villan or a God to pitch the cause. It would be OK, and you would have a lot less blowback, if you just told people we should just keep the place clean and tidy and planetarily operational because that is fundimentally the good and right thing to do. Did you ever stop to notice that for all the guff you take about Global Warming, basically zero people are arguing FOR leaving a mess lying around and F#$%kin’ up the planet. If you just gave people some credit and some room you’d see they’re almost all on your side.
In business, new products follow a predictable path: rapid adoption, then a slowing as the market saturates, and finally a plateau. Think of fads like the fidget spinner or even the rise and fall of once-dominant tech platforms. Yes, I’m looking at you Vine, MySpace, Napster, and Google+.
Understanding these curves isn’t just an economic tool—it’s a critical life model. The ability to recognize when the line starts to curve, when more effort, more consumption, more anything starts to yield less, is a skill that serves us in every aspect of life. It’s about knowing when to stop.
The Virtue of Moderation
This realization ties closely to the ancient idea of moderation, a concept that runs deep in both Eastern and Western philosophy. Aristotle’s Doctrine of the Mean posited that virtue lies in finding the balance between excess and deficiency. The Buddhist Middle Way teaches that wisdom comes from avoiding extremes, whether indulgence or asceticism. In both cases, these traditions speak to the same underlying truth: everything in life, even the things we enjoy most, has a natural limit.
An interesting example of this came up during the Reagan era. The Laffer Curve hit the public spotlight in the 1970s when economist Arthur Laffer famously sketched it on a napkin during a dinner with political staffers, including future Reagan adviser Dick Cheney. The curve illustrates a simple, provocative idea: there's an optimal tax rate that maximizes government revenue, and beyond that point, higher taxes actually lead to less revenue by discouraging work and investment. It became a cornerstone of supply-side economics and was influential in shaping Reagan-era tax cuts, though debates about its practical application persist today. It is for sure true. We know the endpoints. If the tax rate is zero or 100% no taxes will be collected. For every taxpayer, in between there is a limit to how much tax they’ll pay before they start to… well, not be good citizens anymore. The problem is, until you push citizens to this limit you don’t really know where it is.

There’s one crucial point that politicians, bureaucrats, developers, and all of us have to take away from this and all curved lines.
To know what to do next you have to know where you are on the line.
Imagine being lost in the woods. There’s almost no point in heading off in any direction. You can’t know which way to go if you don’t know where you are.
On the Laffer curve, if you are in the green zone raising rates is a great plan. If you are in the red zone, it could lead to revolt. And it’s often VERY difficult to know where you are on the curve. Therefore, most of government, or any decisionmaker’s energy should be spent on really knowing, and understanding where we are on that curved line.
Adm. H. G. Rickover, the father of America’s nuclear navy put it plainly,

So whether it’s Coke, cake, wealth, or power, chasing more isn’t always the answer. What was sound economic planning yesterday may be folly tomorrow. In fact, it's often the main problem. Growth for the sake of growth, without recognizing when the line starts to bend, leads us into unsustainable cycles, be they personal or societal. Learning to see the curve—to understand when the cost outweighs the gain—isn’t just wise; it’s essential for living well.
Liner Thinking on a Spherical Planet
In a world that prizes progress, it’s easy to be seduced by straight lines and upward trends. Politicians, businesses, and self-help gurus often sell us a vision of endless improvement or growth: if we just push harder, sacrifice more, buy this product, adopt this mindset, everything will get better. But life isn’t linear. It's curved. The notion that all growth leads to positive outcomes is fundamentally flawed.
In fact, some of our greatest challenges—climate change, inequality, even personal burnout—can be traced back to ignoring the limits of the systems we live in. The economist Thomas Malthus warned of the dangers of unchecked population growth centuries ago, but his deeper insight was that all systems—whether population, economies, or even ecosystems—reach a point where growth becomes a burden rather than a benefit.
All systems—whether population, economies, or even ecosystems—reach a point where growth becomes a burden rather than a benefit.
The Takeaway: Recognizing the Curve
The earth may seem flat at the horizon. It’s a matter of perspective. Zoom out. See the bigger picture. It is clearly curved.
Ultimately, recognizing that all lines are curves gives us a more balanced, and realistic view of the world. It helps us manage expectations, avoid burnout, and make better decisions—whether we’re thinking about our next career move, how much soda to drink, or the future of the planet. It teaches us that the goal isn’t to push for constant expansion, but to know when enough is enough.
So next time you reach for that bottle of Coke on a hot day, enjoy that first cold sip. But remember: after a few more sips, you’ll wish you had stopped earlier. Because in life, all lines are curves.
Up Next…
What was wrong with Stanford University biologist Paul R. Ehrlich’s graph and jeremiad argument in THE POPULATION BOMB? His graph is a curve. Why didn’t we realize the horrors of the population explosion?

Well, it was sort of a curve. It has a curve, but it projects a straight line. There are almost no straight lines in the long run. Einstein predicted that even light, space, time, and reality bends in a particular way. I’ll explore the effects of local politicians and planners imagining they know better than Einstein in the next part and what kind of curve is really most common.
